Hi Ivan
Need your help to understand the results of the moving average backtest that I have done.
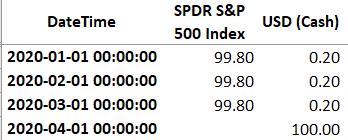
In the backtest, the stock selected is SPY with cash allocation box being checked. When I looked at the allocation of the SPY and cash, the strategy indicated that the weight for SPY and cash was 99.8 and 0.2 from Jan 20 to Mar 20 respectively. The weight for SPY changed to 0 in Apr 20 (see screenshot below).
However in the results published for this backtest, the max drawdown was -17.3% (see screenshot below).
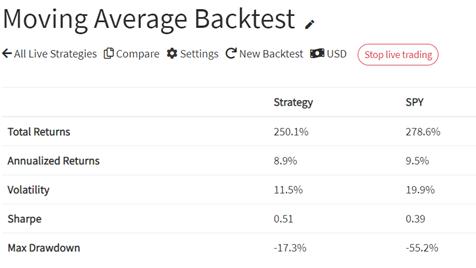
Since the drawdown from Feb 20 peak to the trough in Mar 20 for SPY was -35%, why was the max drawdown for the strategy at -17.3%?
4 Replies
Hi Ivan
Thanks for your reply.
Is it possible for you to include a section for the historical data of all the entry and exit signals for the strategy so that it is easier to understand the results of the backtest?
Just saw your backtest. Makes sense, because you are rebalancing weekly so the historical positions which are monthly snapshots might not capture your position changes at a weekly time frame. Do let me know if you have further questions. Thanks!
Hi Ivan
I have attached the backtest results to my original post.
Thanks for your help.
Hi Yeo,
Can you kindly let me know the link to your backtest results so I can take a closer look?
The max drawdown could be lower because the strategy might be holding cash between 1st March 2020 and 1st April 2020. Hence even though SPY was down -35%, the strategy is down only -17.3%.
The positions you got are the historical positions which are snapshots every month. They are not shown on a daily time scale so it did not capture the changes between 1st March and 1st April.
© PyInvesting 2026

