The investment universe consists of ETFs from 10 different sectors. Every month, the three ETFs with the highest one-year returns form an equally weighted portfolio.
Data-quality notes. Unavailable one-year return observations were omitted until sufficient history was available. This uses a fixed ETF universe, not a point-in-time universe.
Simulated monitoring
- Recorded request period
- 2005-07-01 to 2026-10-23
- Currency
- USD
- Recorded status
- Completed
- Universe coverage
- Selected instruments
- Statistics scope
- Recorded NAV observations
- Costs
- Cost breakdown unavailable in this summary. Review recorded assumptions below.
Read return alongside volatility and drawdown. Review the recorded period, costs and data coverage before comparing strategies. Missing assumptions are unavailable, never assumed to be zero.
How to interpret this result
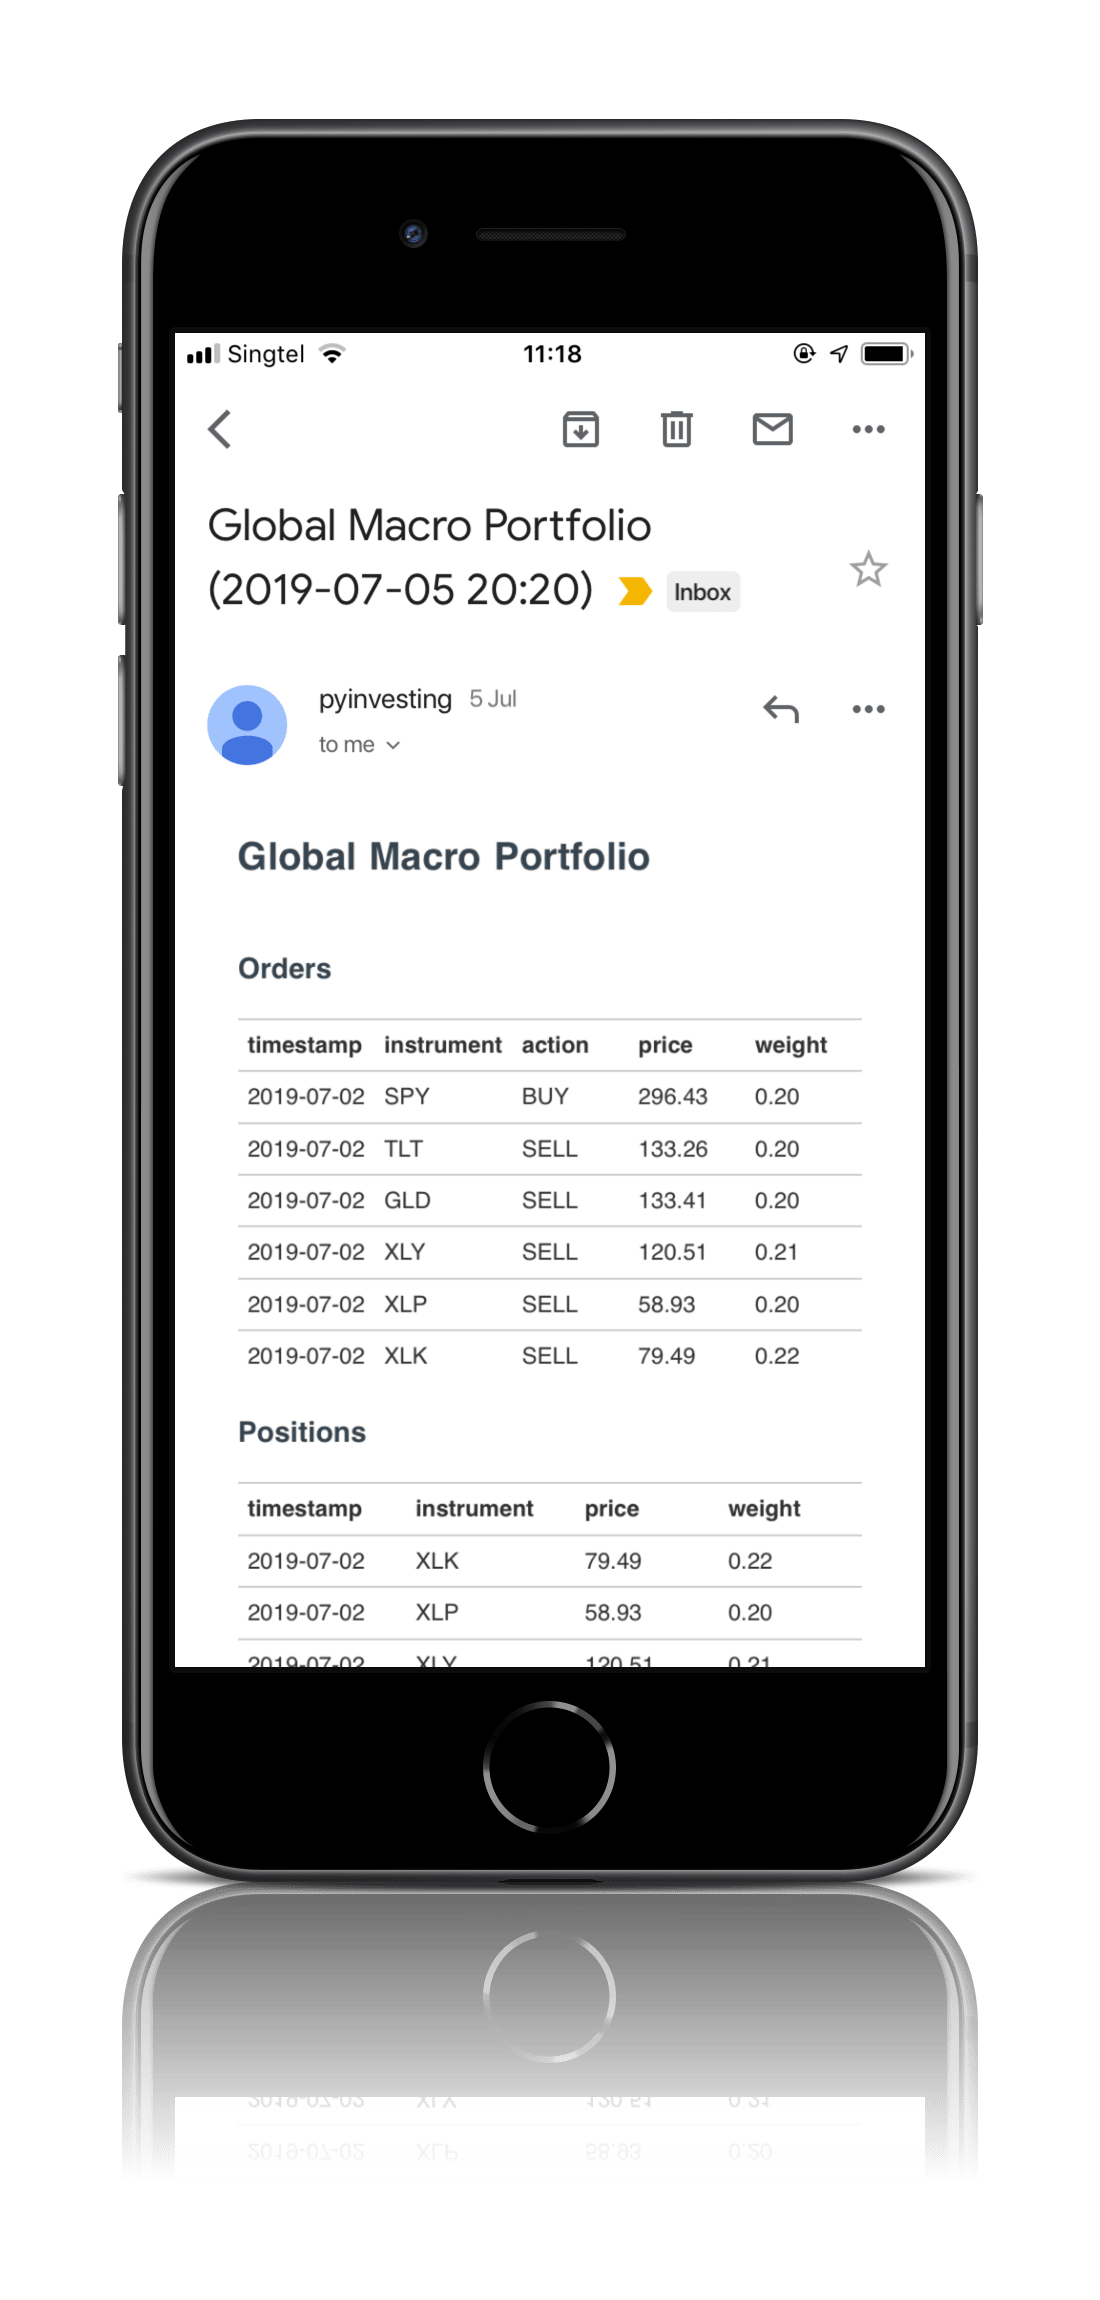
Chart window controls change the visible history. Zooming the chart does not recalculate the recorded statistics. Simulated allocations and order notifications require your review; they are not evidence of brokerage execution.
Methodology: Backtesting methodology and limitations.
Performance and strategy calculations use adjusted close, including split and dividend adjustments. Quantities are adjusted simulation units.
Statistics use the recorded NAV observations. Annualized return uses the elapsed time between the first and last recorded NAV dates, which can be narrower than the recorded request period. Chart zoom changes only the visible history.
Why does it work?
Selecting sectors using a trend following strategy allows investors to take advantage of specific sectors that have strong momentum.
The original 2020 article described avoiding energy stocks during the oil-price decline and holding health care stocks that were trending. This illustrates how sector selection responds to changing trends. It does not describe current holdings. In the backtest period reported below, the strategy had lower volatility and a smaller maximum drawdown than SPY, but lower annualized returns and a lower Sharpe ratio.
What is the performance?
The Performance and Statistics tabs show the current verified adjusted-price simulation in USD, with SPY as the S&P 500 ETF benchmark. Annualized returns, volatility, Sharpe ratio and maximum drawdown are calculated from the same published result. Use the chart dates to identify the period being compared. The Positions tab samples historical simulated allocations; its last displayed date can differ from the final performance date.
What are the simulated positions?
The discussion of consumer staples, health care and technology in the original article was a historical example from the 2020 COVID-19 period. See the dated, sampled allocations in the Positions tab for historical simulated holdings.
Research paper
Mebane Faber: Relative Strength Strategies for Investing
http://papers.ssrn.com/sol3/papers.cfm?abstract_id=1585517