How Do You Trade Trends in the Market?
The turtle strategy was used by one of the most successful trend followers in history, Richard Dennis, who borrowed $1,600 and reportedly made $200 million in about ten years. The strategy states that when the price of instruments hits a 3 month high, we buy. And when the price of an instrument hits a 3 month low, we sell. The strategy provides an effective form of capital protection for investors yet allows investors to participate in the upswings of the market.
Backtesting the turtle strategy
To test the effectiveness of the turtle strategy, I simulated the strategy using a backtesting framework built with Python.
The simulation works by:
- Pulling historical prices of the S&P 500 ETF (SPY) into my database.
- Building the trading signals by using the rolling maximum/minimum of a 3 month window period.
- Submitting orders whenever a buy or sell signal was generated.
- Generating plots to show the results of the backtest.
The plots below show the results of my simulation. The top plot shows the price of the S&P 500 (dark blue line) sandwiched between it’s rolling maximum (light blue line) and rolling minimum (purple line). Following the rules of the turtle strategy, when the price of the index crosses above it’s rolling maximum, we go long on the index. When the price of the index crosses below its rolling minimum, we close our long position.
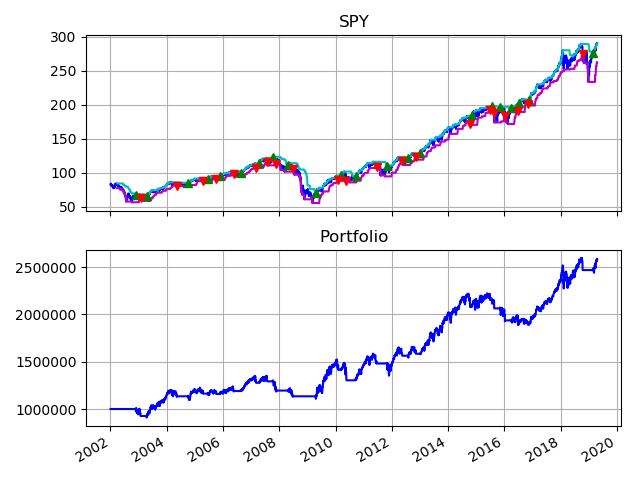
The profit and loss (PNL) value of the portfolio is shown in the lower graph. $1 million dollars invested in 2002 would result in slightly over $2.5 million today. While the returns may look unimpressive, traders typically use highly leveraged financial instruments such as futures contracts to magnify gains. This is possible because of the lower risk of the strategy which provides downside protection. For example, during the 2008 recession, the portfolio only lost 18% vs the market (down 56%).
To most investors, however, this strategy would not be appealing because of its high turnover. We can see that to employ this strategy, investors would need to frequently buy and sell the index. This is highly inconvenient and would result in high trading cost.
Can we do better?
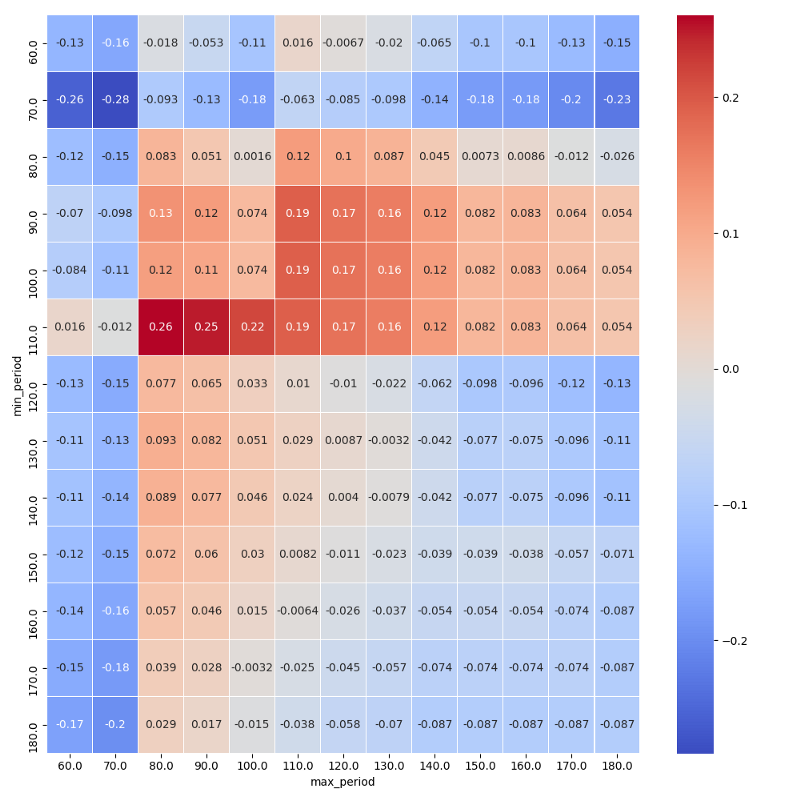
The original turtle strategy used a 3-month signal horizon to trade the market (i.e. they bought the index when it’s price hit a 3 month high and sold the index when it’s price hit a 3 month low). With a computer, we can easily run the strategy using different parameters for the signal horizon and figure out the set of parameters that results in the best performance.
Here are the results. The metric I used to gauge the performance of the strategy is the Sharpe ratio, which measures the return to risk ratio. The higher the Sharpe ratio, the higher the return of the strategy for a given level of risk. The results show that the strategy using 80 days for the maximum rolling window and 110 days for the minimum rolling window has the highest Sharpe ratio of 0.26.
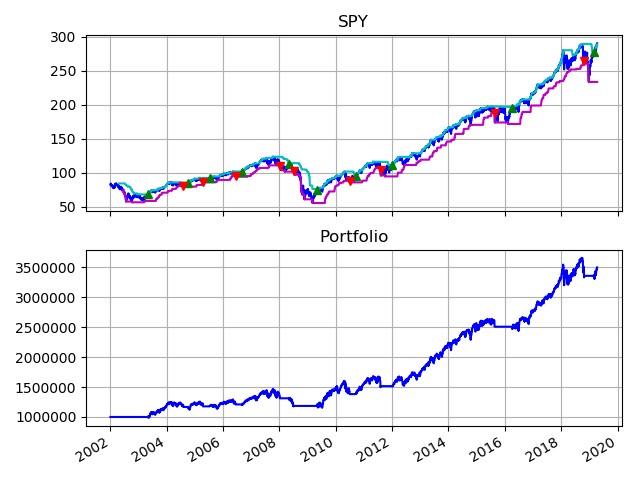
Now let’s re-run our simulation using these parameters. The results show that $1 million dollars invested in 2002 would result in slightly over $3.5 million today. That is a whooping 170% higher than the original turtle strategy. The frequency of trades is also much lower, making it easier to implement and incurring lower transaction cost.
When it comes to investing, everyone has their own styles and strategies. I rely on systematic strategies because I can simulate their performance and convince myself that they can outperform the market.


