
Updated 12 October 2026 by PyInvesting. This revision reflects the current workflow; the original publication and author are retained.
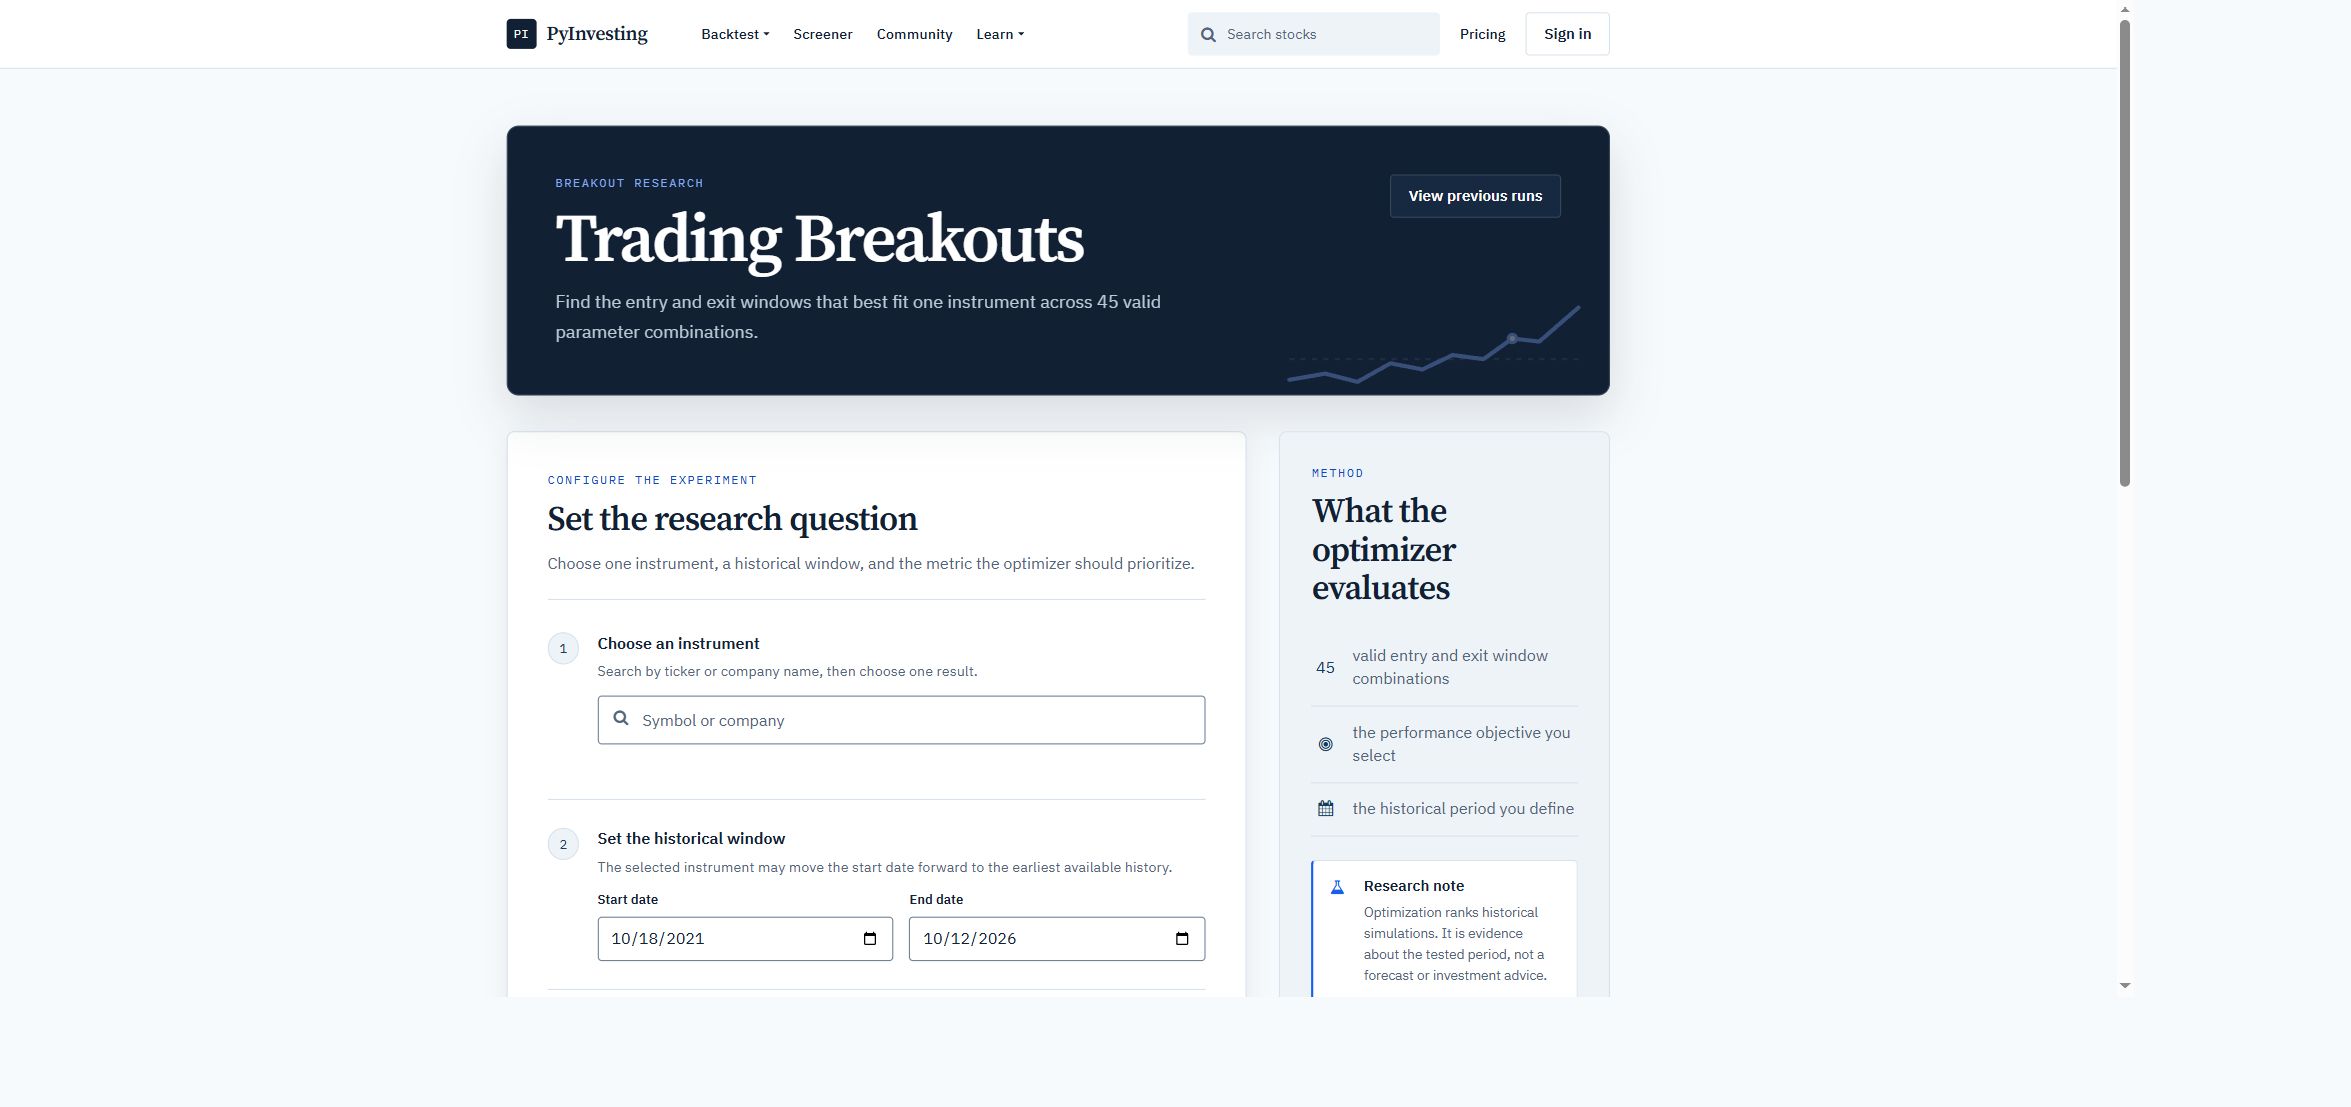
PyInvesting's breakout optimizer compares a defined set of historical rules for one instrument. It evaluates 45 valid entry and exit window combinations against the objective you choose. The output is evidence about the tested period, not a forecast of which stocks or settings will profit next.
Start with a reproducible research question
Write down the instrument, historical dates, reporting currency and objective before running. An objective selected after reviewing the results is another form of selection. Choose a question such as whether the historical behavior is reasonably stable across nearby window pairs, rather than treating the highest-ranked result as a future optimum.
| Current form field | What to record |
|---|---|
| Choose an instrument | One selected ticker, exchange and instrument identity; verify the available history. |
| Start date / End date | The requested dates and the dates actually used by a completed result. Available history may constrain the start. |
| Reporting currency | The currency used for values and returns; inspect exchange-rate assumptions. |
| Choose the objective | Sharpe, Returns or Drawdown. Record the objective before inspecting results. |
Download the research worksheet. It records assumptions and result checks; it contains no claimed investment outcome.
Run the current optimizer
- Open Trading Breakouts and select one instrument from the search results.
- Review the dates, reporting currency and objective. Keep a copy of these inputs.
- Sign in and check your access before submitting. Select Run breakout analysis once, then follow its progress and any data or admission message.
- Review a completed result with its actual history and execution assumptions. A queued, failed or unavailable run provides no successful performance evidence.
The entry and exit windows belong to the optimizer's grid; they are not extra fields on this form. Entry windows run from 20 to 200 in steps of 20. Each exit window is a positive multiple of 20 below its entry window: 1 + 2 + … + 9 = 45 valid pairs. A 120/60 pair is a valid example to inspect, without implying a particular result.
Read the evidence beyond the winner
Compare returns, drawdowns, trade behavior and neighboring parameter pairs over the same dates. A narrow peak can reflect selection of an unusually favorable historical configuration. Record all alternatives examined. Use an untouched evaluation period where the available workflow permits, and do not optimize that period after seeing the answer.
Check execution and data assumptions
The current engine reports execution assumptions, including modeled commission, spread and market-impact constraints. Those assumptions need not match your broker, taxes, liquidity, financing or actual fills. Inspect the reported price basis, currency, timing and cost settings rather than assuming the result is frictionless or fully realistic.
This is daily historical research. It does not establish intraday trading performance, continuous data coverage or freedom from data revisions and selection bias. A completed backtest is distinct from live execution.
Keep a record and compare methods
Retain the requested inputs, actual dates, objective, compared window pairs, execution assumptions and completed-result identifier. Treat a revised question as a new experiment. The no-code relative-strength walkthrough explains a separate ranking method. The public method chooser compares the questions different builders address.