Here's Why Every Investor Should Backtest Their Investment Strategy

What is Backtesting?
Backtesting is the process of simulating an investment strategy using historical prices to test how well the strategy would have done in the past. Running a simulation over a large number of stocks over the past decades is a computationally intensive process. Fortunately, with the help of technology, investors can rely on backtesting software to run these calculations in a matter of seconds. Some of the most popular backtesting frameworks used to backtest trading strategies are created using Python code.
Why is Backtesting Important?
Investment backtesting allows investors to analyze the historical behaviour of an investment strategy and determine how profitable the strategy is. If the backtest results show that a strategy has high returns and low risk, investors will have greater confidence of going live with the strategy. The main idea is that any investment strategy that has performed well in the past is likely to perform well going forward. Conversely if a backtest on a particular investment strategy shows poor performance, the strategy should be rejected because if it performs poorly in the past, it is unlikely to perform well in the future.
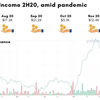
Backtesting investment strategies also helps investors understand their strategy’s behaviour during different key periods in history such as the global financial crisis and the Covid-19 public health crisis. They will know how much money they can expect to lose during these black swan events. For older investors, taking on too much risk could mean significantly delaying your retirement. For younger investors who are investing on margin (borrowed money), a large drawdown could mean receiving the dreaded margin call from your stock broker. By backtesting our investment strategy, we are able to know exactly how much money we will lose during these difficult periods so we are able to determine how much risk we can afford to take before we actually start investing.
What kind of investment strategies can be backtested?
Any strategy that can be expressed as a set of rules can be backtested. For example, a value investor might be interested in a strategy that selects 10 stocks with the lowest price to earnings ratio every year. Similarly an investor that relies on technical analysis might look at buying a stock when its fast moving average crosses above its slow moving average.These strategies all follow a consistent set of rules that can be simulated using historical data. The advantage of rules based investing is that it removes emotions from the picture. Every decision to buy or sell a stock is driven completely based on logic. This prevents investors from making behavioural mistakes such as panic selling or buying due to the fear of missing out.
How do we create a realistic backtest?
As the purpose of investment strategy backtesting is to find out how effective an investment strategy is, it is important to ensure that our backtest is as realistic as possible. This prevents us from creating backtests that look very attractive on paper but yet perform poorly during live trading. There are a few ways to achieve a more realistic backtest.
1. Choose a large investment universe of at least 100 stocks
A large universe will allow your strategy to select from a wide variety of stocks. This is important because it allows us to test whether the strategy is able to pick winning stocks from a large basket of stocks. A great strategy will be able to differentiate between winners and losers. However, if we restrict our investment universe to a small number of stocks, there are not many stocks for the strategy to select from. This makes it difficult for us to confirm whether a strategy works because both a great and a poor strategy are likely to pick the same stocks when there are so few to choose from.
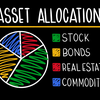
2. Include at least 20 stocks in your portfolio
Having 20 stocks equally weighted in your portfolio will reduce your portfolio’s concentration risk. This means that no single stock will have a huge impact on your portfolio’s performance which allows us to reduce the chance that your strategy just happened to be lucky and picked a winning stock. For example, if our strategy only picked Tesla and was 100% invested, it would have made huge returns over the last few months. However I would not be convinced that the strategy works because it could have picked another stock out of sheer randomness. It is much harder for a strategy to pick 20 winning stocks than a single winning stock. By ensuring that our strategy holds a diversified portfolio, we can confirm that the strategy is able to consistently pick multiple winning stocks and include them in a high sharpe ratio basket of stocks.
3. Choose a sufficiently long backtest period
Ideally, your backtest period should be at least 15 years. This allows us to observe how the strategy performs over multiple economic regimes. For example, by including the 2008 financial crisis which happened 12 years ago, we can understand how much money our strategy would lose during a crisis. This allows us to manage the risk of our portfolio. For older investors that are retiring soon, this means deciding how much money they should invest in the market such that even if a crisis were to happen, they would have enough cash savings to retire as planned. For younger investors investing with leverage, it could mean understanding how much money they can afford to lose during a crisis without being hit by a margin call.
4. Include transaction cost
The backtest should include your broker’s transaction cost. Whenever an investor buys or sells stocks, they would incur transaction cost that is paid to the broker. Over time as the number of transactions increase, your transaction cost will increase which would have a significant impact on your strategy’s returns. Moreover, strategies that have high turnovers and make a lot of trades will incur higher transaction costs than strategies that have low turnovers. Hence it is important to include transaction cost so we get a realistic idea of how much money our strategy will make during live trading.
How do we create a backtest?
While backtesting requires a great deal of calculations, there are multiple websites we can use to create a backtest easily without writing a single line of code. These platforms include https://www.portfoliovisualizer.com/, https://www.etfreplay.com/, https://www.tradingview.com/ and https://pyinvesting.com/. In the table below, I compare the different backtesting platforms and weigh the pros and cons.
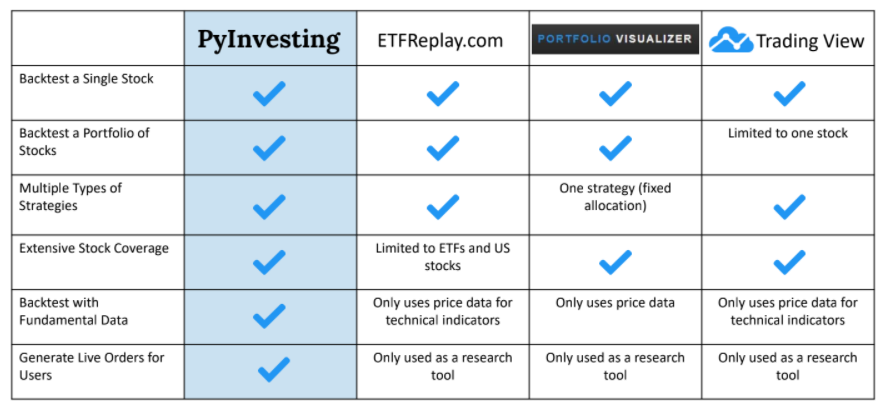
To be able to backtest a portfolio of different stocks, all platforms except TradingView provide this functionality. TradingView is used more for backtesting a single stock and does not allow users to analyze the performance of a portfolio with multiple stocks.
In terms of allowing users to backtest different kinds of strategies, Portfolio Visualizer is the only platform that lacks options. They only allow users to run an allocation backtest where the user has to specify the weights of each stock in the portfolio. All other platforms allow users to choose from multiple types of backtests such as relative strength and moving average backtests.
Regarding stock coverage, all platforms have extensive coverage across multiple exchanges except ETF Replay which is limited to ETFs and a handful of US stocks. If you invest in the Singapore market, unfortunately this platform will not be very helpful as it does not include Singapore stocks.
Among the different platforms, only PyInvesting provides fundamental data such as price to earnings ratio, free cash flow, return on equity, profit growth and more. These fundamental data are obtained from the company’s financial statements going as far back as 15 years. For investors that rely on fundamental data, this is currently the only platform that allows you to create a backtest using fundamental data without writing a single line of code. All other backtesting platforms above only provide technical indicators based on price or volume data which is not suitable for most long term investors.
Finally, only PyInvesting allows users to go live with their investment strategy on the cloud. The website will send users an email to update them on their live positions and orders which they can trade on their personal account.
Here is a tutorial on how you can use PyInvesting to create a moving average backtest where the algorithm would select stocks trading above their moving average and sell stocks that are trading below their moving average.
Final Thoughts
Every investor should backtest their investment strategy because it allows them to analyze the historical behaviour of their investment strategy and determine how effective it is. Backtesting also helps investors understand their strategy’s behaviour during different key periods in history which allows them to manage their risk. Finally backtesting allows investors to follow a logical set of rules which removes emotion from the picture and helps them make data driven decisions.