3 Ways to Evaluate the Performance of your Investment Strategy
Do you happen to know that one guy who only invests a single stock because it is the hottest stock in the market? This guy is usually the loudest person in the room and will always brag about how much money he made just dumping his entire net worth into a Tesla stock. Let’s call him, Mr Tesla.
Another guy that you might know, loves to invest in tech companies. He is the guy that queues up for hours just to get hold of the latest iPhone on the same day that it is released into the market. Because of his obsession with technology and IT gadgets, his favourite stocks to invest in are Facebook, Apple, Amazon, Netflix and Google also known as FAANG stocks. Let’s call him, Mr FAANG. Mr FAANG holds an equal weighted portfolio of FAANG stocks and rebalances his portfolio once a year using a strategic allocation backtest.
One day, Mr Tesla and Mr FAANG bumped into each other at a bar, got drunk, and started arguing with each other about who is the better investor.
Mr Tesla: “My returns are higher!”
Mr FAANG: “But your risk is higher too!”
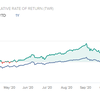
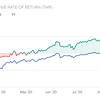
They both have a point. Mr Tesla has a higher return of 44.6% vs Mr FAANG’s less impressive 34.5%. However, Mr FAANG’s portfolio has a lower volatility of 25.3% vs Mr Tesla’s portfolio of 53.5%.
So who is the better investor?
Introducing risk adjusted returns
While Mr Tesla does indeed have a significantly higher annualized return than Mr FAANG, he achieves this annualized return at more than double the volatility of Mr FAANG. To compare Mr Tesla’s performance against Mr FAANG, we need to use a performance metric that rewards investment strategies with high returns while penalizing strategies with high risks. This is known as the risk adjusted returns of a strategy. Investors generally prefer higher risk adjusted returns as compared to simply higher returns because it accounts for the difference in risk between strategies.
Sharpe ratio
The Sharpe ratio is one of the most common measurements of risk adjusted returns. It is the excess return of your strategy divided by its volatility. The excess return can be obtained by subtracting the risk free rate from the annualized returns of your strategy. The risk free rate is the return from investing in a safe instrument such as the yield for US treasury bonds.
Sharpe ratio = (Annualized returns - Risk free rate) / Volatility
The higher the returns of a strategy, the larger the numerator, the higher the Sharpe ratio. The higher the volatility, the larger the denominator, the lower the Sharpe ratio.
Doing the math for both strategies, Mr FAANG comes out ahead of Mr Tesla with a Sharpe of 1.25 vs 0.78.

Sortino ratio
The next measure of risk adjusted returns is the Sortino ratio. This ratio is slightly different from the Sharpe ratio where instead of dividing the excess returns by the volatility, we divide the excess returns by the semi deviation. The semi deviation is calculated by measuring the volatility on days when the strategy has negative portfolio returns.
Sortino ratio = (Annualized returns - Risk free rate) / Semi deviation
Using the semi deviation makes sense because any investor should welcome upside volatility as it translates to higher returns. By differentiating between harmful volatility from the overall volatility of a strategy, the Sortino ratio provides a better representation of risk adjusted returns than the Sharpe ratio.
Going back to Mr FAANG’s and Mr Tesla’s investment strategy, we can see that Mr FAANG still comes out ahead of Mr Tesla with a higher Sortino ratio of 1.60 vs 1.11

Calmar Ratio
The Calmar ratio is another measure of risk adjusted returns. Unlike the Sharpe and Sortino ratios that depend on volatility, the Calmar ratio looks at the maximum drawdown of a strategy.
The maximum drawdown is the maximum loss from peak to trough of your portfolio’s value before a new peak is attained. For example, the maximum drawdown of the S&P 500 was 56% as it lost 56% from its peak in October 2007 to March 2009 before going on to recover from the global financial crisis. The Calmar ratio is calculated by dividing your strategy’s annualized returns by its max drawdown.
Calmar ratio = Annualized returns / Max drawdown
The Calmar ratio might appeal more to some investors because the max drawdown is a better indicator of your strategies risk. While volatility is commonly used as a proxy for risk, it does not give the investor an idea of how much he could lose during black swan events like what we saw during the recent Covid crisis.
Comparing Mr FAANG’s and Mr Tesla’s investment strategy, we can see that Mr FAANG wins with a higher Calmar ratio of 1.08 vs 0.74

How do you improve your risk adjusted returns?
Overall, Mr FAANG’s investment strategy has higher risk adjusted returns as compared to Mr Tesla. All 3 performance metrics (Sharpe, Sortino and Calmar ratios) were higher for Mr FAANG’s strategy.
There are 3 key reasons why Mr FAANG’s strategy outperformed with higher risk adjusted returns.
-
Diversification. Everyone knows that the only free lunch on wall street is diversification and that we should never put all our eggs in one basket. By spreading his bets among 5 different stocks, Mr FAANG was able to reduce the risk of his portfolio as compared to Mr Tesla who was all in on a single stock. The logic behind this is that by investing in different stocks, the portfolio’s volatility is lower because of different stocks moving in different directions and at different pace where the correlation between different stocks is less than 1.
-
Equal weighting. By equal weighting the portfolio among 5 different stocks, there is a much smaller concentration risk in the portfolio as compared to holding a single stock. By allocating the weights equally between different stocks, it ensures that even if one of the stocks does not do well, the impact on the overall portfolio will be limited. We are betting on the average performance of every stock in the portfolio rather than on a single stock hitting a home run for us.
-
Rebalancing. The purpose of rebalancing is to adjust the weight of each stock in the portfolio back to its target weight so that we can maintain our equal weighting over time. As the different stocks in the portfolio have different performance, over time this difference in returns gets larger causing the weights between each stock to differ from their target allocation of 20% per stock. Rebalancing involves taking profits on some stocks that have performed well and reinvesting these profits into stocks that have fallen in value. This allows us to keep the weights between different stocks equal over time and reduce concentration risk in our portfolio.
Happy investing, and may the odds be in your favour.
If you want to develop an effective investment strategy, learning how to utilize the results of backtesting can be one of the best decisions you ever make since backtesting can help you identify an incorrect or correct investment before your money is on the line. PyInvesting is a backtesting platform that helps investors go live with their investment strategies on the cloud without writing a single line of code.
Check out the tutorial video below to see a live demo of how to analyze the performance of your backtest.


