Beating the S&P 500 by selecting US stocks with strong fundamentals
Most long term investors rely on fundamental data to decide which stocks they should include in their portfolios. Fundamental data can be obtained from financial statements such as the company’s balance sheet, income statement and cash flow statement. These reports provide valuable insights into the company’s financial health, profitability and growth. These are key fundamental factors that investors should look out for as they are highly correlated to the stocks performance.
However, measuring these fundamental factors is a tedious process. Investors need to comb through hundreds of financial reports to search for these factors and then combine these different factors together to rank the available stocks. Fortunately with the help of technology, this whole process has been simplified for us. Here is how you can go live and profit from a fundamental strategy for US stocks.
investing.com
Introducing PyInvesting.com
PyInvesting is a website that provides financial data and backtesting tools to help you go live with your own investment strategies. Our backtesting software helps you comb through hundreds of financial reports and tells you which stocks you should trade based on your personal investment strategy. We are going to use PyInvesting to create our fundamental strategy for US stocks. Let’s go!
First go to https://pyinvesting.com/backtest/fundamentals/ where we will be creating a fundamental backtest. A backtest is a simulation of our investment strategy using historical data. If the simulation results are poor where the strategy significantly underperformed its benchmark, it confirms that the strategy does not work. In contrast, if the strategy significantly outperforms its benchmark, it gives us confidence that it’s likely to perform well going forward. The backtest also tells us what stocks we should be holding in our portfolio so we know which stocks to buy or sell when we go live with our strategy.
Click on the “Select your stocks” button which opens a window to select stocks for your fundamentals backtest. Under template portfolios, click on “S&P 500” to select s&p 500 stocks from the index. The default benchmark is the SPDR S&P 500 Index (which passive investors can use to invest in the s&p 500) where we will compare the historical performance of our fundamentals investment strategy against the s&p 500 historical prices.
Financial Health
We want to select companies with a healthy balance sheet and a low debt to equity ratio because these companies have strong abilities to repay their creditors. Because these companies have relatively low leverage, these companies are usually quite resilient and are able to survive through tough periods without going bankrupt. As a result, investors holding these stocks tend to lose less money during a crisis because these stocks are well positioned to weather a storm.
Profitability
Next, we want to select companies that are highly profitable, and have a high return on equity. A high return on equity implies that the company’s management is efficient in using investment financing to grow their business and is hence able to provide better returns to investors. A low return on equity implies that the company could be mismanaged where the management is investing in unproductive assets. Return on equity is also a measure of how efficient the company is using its resources. A high return on equity could mean that the company is increasing its profits with a relatively low amount of capital.
Growth
Finally, we want to select growth companies whose earnings increase at a much faster rate than the overall economy. These companies have high profit growth and tend to reinvest their earnings into profitable areas of their business. They usually do not pay dividends and choose to reinvest profits to further grow their business. Most growth companies such as Tesla, Google, and Amazon are in the technology sector where they are constantly investing in innovative ideas and expanding into new businesses. Growth companies are able to provide huge returns to investors by focusing on revenue growth and maintaining leadership in their industry.
Constructing our portfolio strategy
To select stocks with strong financial health, profitability and growth, we are going to select 3 factors shown below. Stocks with the highest return on equity, highest profit growth and lowest debt to equity. These 3 factors are equally weighted at 33% each. All other factors in the table are allocated a weight of 0%. The website will automatically combine these 3 factors for you using a z-scoring approach where the factors are normalized using the mean and volatility.
Subsequently, we need to decide how many stocks to hold in the portfolio. I decided to hold 20 equally weighted stocks in my portfolio to avoid concentration risks. Every month, the stocks from the S&P 500 are ranked based on these 3 fundamental factors and the top 20 stocks are selected to form an equal weighted portfolio.
Performance
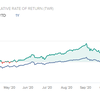
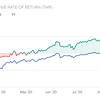
The results show that our fundamental strategy for US stocks significantly outperforms the S&P 500 benchmark with an annualized return of 17.8% vs 9.0% since 2006. The strategy also has a higher Sharpe Ratio of 0.73 vs the S&P 500 which has a Sharpe Ratio of 0.37 implying that the strategy has higher risk adjusted returns. While the strategy has a higher volatility than the S&P 500, it has a lower semi deviation than the S&P 500. This means that the strategy has lower downside volatility and higher upside volatility. The max drawdown of the strategy is also significantly lower than the S&P 500 where it lost 46% during the 2008 crisis vs the S&P 500 which lost 55.2%.
Overall, this backtest confirms that the fundamental strategy for US stocks works where if we select stocks with the highest return on equity, highest profit growth and lowest debt to equity ratio, we can expect to outperform the S&P 500 by 8.8% every year. This strategy is suitable for long term fundamental investors who can afford to take on some market risk in exchange for significantly higher returns.
The website also shows the current positions in the portfolio which users can trade on their own personal account. Subscribers have the option of “going live” with their portfolios where they will receive daily email updates to notify them if their strategy decides to make a trade. I’ve added a link below for users to check out the backtest results from this strategy.
https://pyinvesting.com/invest/results/ab3d20df353143a7a41cdb5ab05e83c2
If you want a full video demonstration of how to create a fundamentals backtest, check out this tutorial video below.
Do consider signing up for a free account with PyInvesting to receive future updates. In my next article, I will be explaining how to use the relative strength backtest. Stay tuned and I’ll see you guys next time!


