Outperforming the market with high dividend yield stocks
One of the key factors most investors look out for when purchasing stocks is how much dividend the stock pays. A dividend is a reward that the company pays to its investors which usually stems from its net profit.
When a company pays high dividends, it usually indicates that a company is doing well and is able to distribute part of its earnings to its investors. These companies tend to be large, established companies with strong and predictable cash flow.

However, not all companies that pay high dividends make good investments. Some companies continue making dividend payments even when they are not profitable. This is to maintain their track record of making regular dividend payments.
An example would include Exxon Mobil, a huge oil and gas company. Exxon Mobil has a consistent tracking record of paying dividends every quarter since 2013. However, an investor that bought the company since 2013 would have lost 14% vs the S&P 500 which made 101% during that period.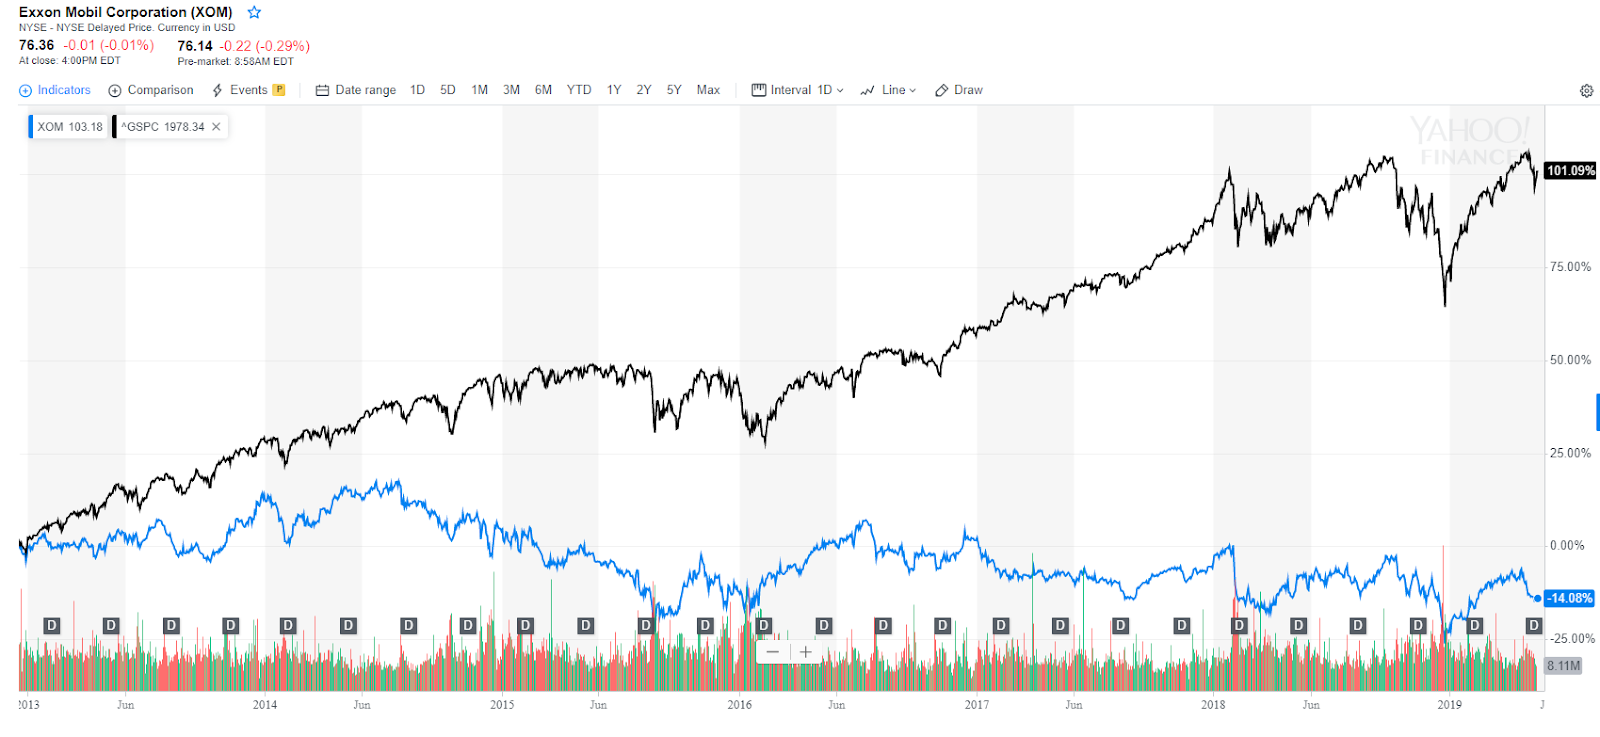
Do high dividend yield stocks outperform?
To find out whether the dividend yield factor is able to select stocks that outperform the market, I run a backtest using Python code to simulate the performance of the strategy using historical data.
From an investment universe of 500 stocks, I select 50 stocks with the highest trailing dividend yield. The trailing dividend yield is the dividends per share over the trailing 12 months divided by the stock price. It is a measure of how much cash flow you are receiving for every dollar you invest in the stock.
To select the stocks, I rank each stock in the universe based on their trailing dividend yield. I equal weight each of the 50 stocks in the portfolio to reduce the concentration risk of the portfolio. This will prevent my portfolio from taking a big hit if any single stock crashes.
In addition, stocks with the strongest signal within each sector are selected such that no single sector has a weight larger than 20% of the portfolio. This reduces sector risk and allows us to isolate the source of out performance due to the high dividend yield signal.
Performance
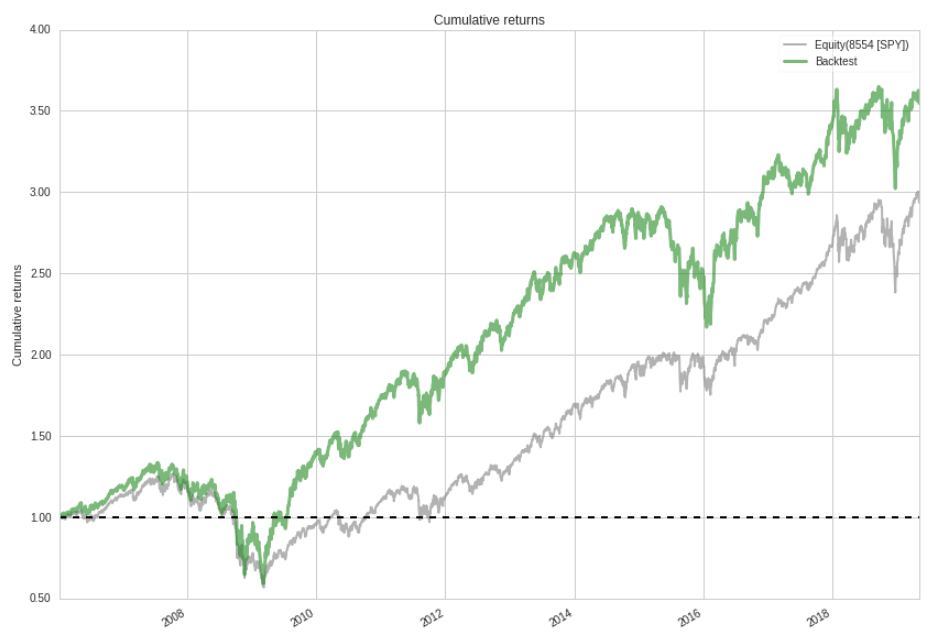
The backtest results show that the high dividend yield strategy has an annualized return of 10% and volatility of 20.7%. The strategy has cumulative return of 255%, outperforming the S&P 500 benchmark by almost 55% since 2006.
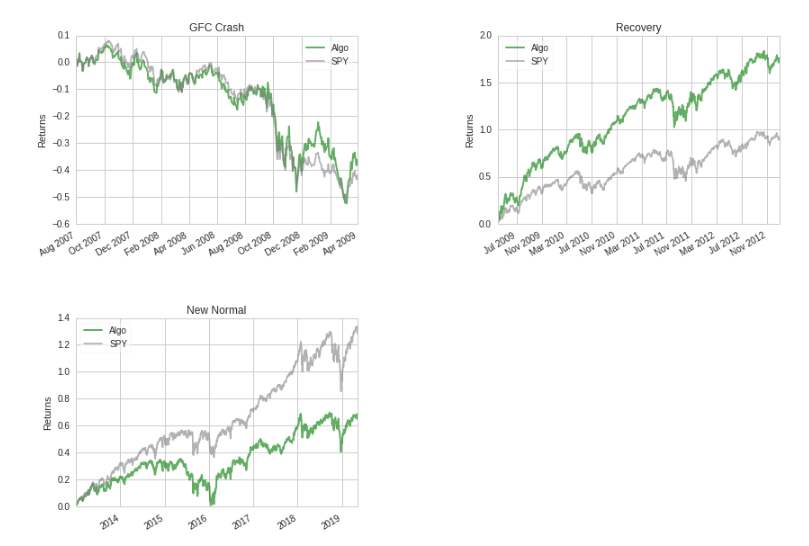
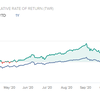
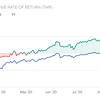
We can also analyse the performance of the high dividend yield strategy over different periods. The plots above show that during the great financial crisis, the strategy’s performance was almost in line with the S&P 500 benchmark.
During the crisis recovery period from 2009 to 2012, the strategy significantly outperformed the benchmark by 80%. However from 2013 to 2019, the strategy has been giving up some of those gains, under performing the benchmark by 60%.
Conclusion
By selecting a portfolio of stocks with the highest dividend yield in each sector, we were able to develop a strategy which outperforms the market.
The simulation also showed that the strategy performed well during the crisis recovery period but gave up a significant chunk of its gains during the new normal period from 2013 to 2019.
In the next article, I will be discussing how we can improve the performance of the high dividend yield strategy by combining it with the quality factor.


