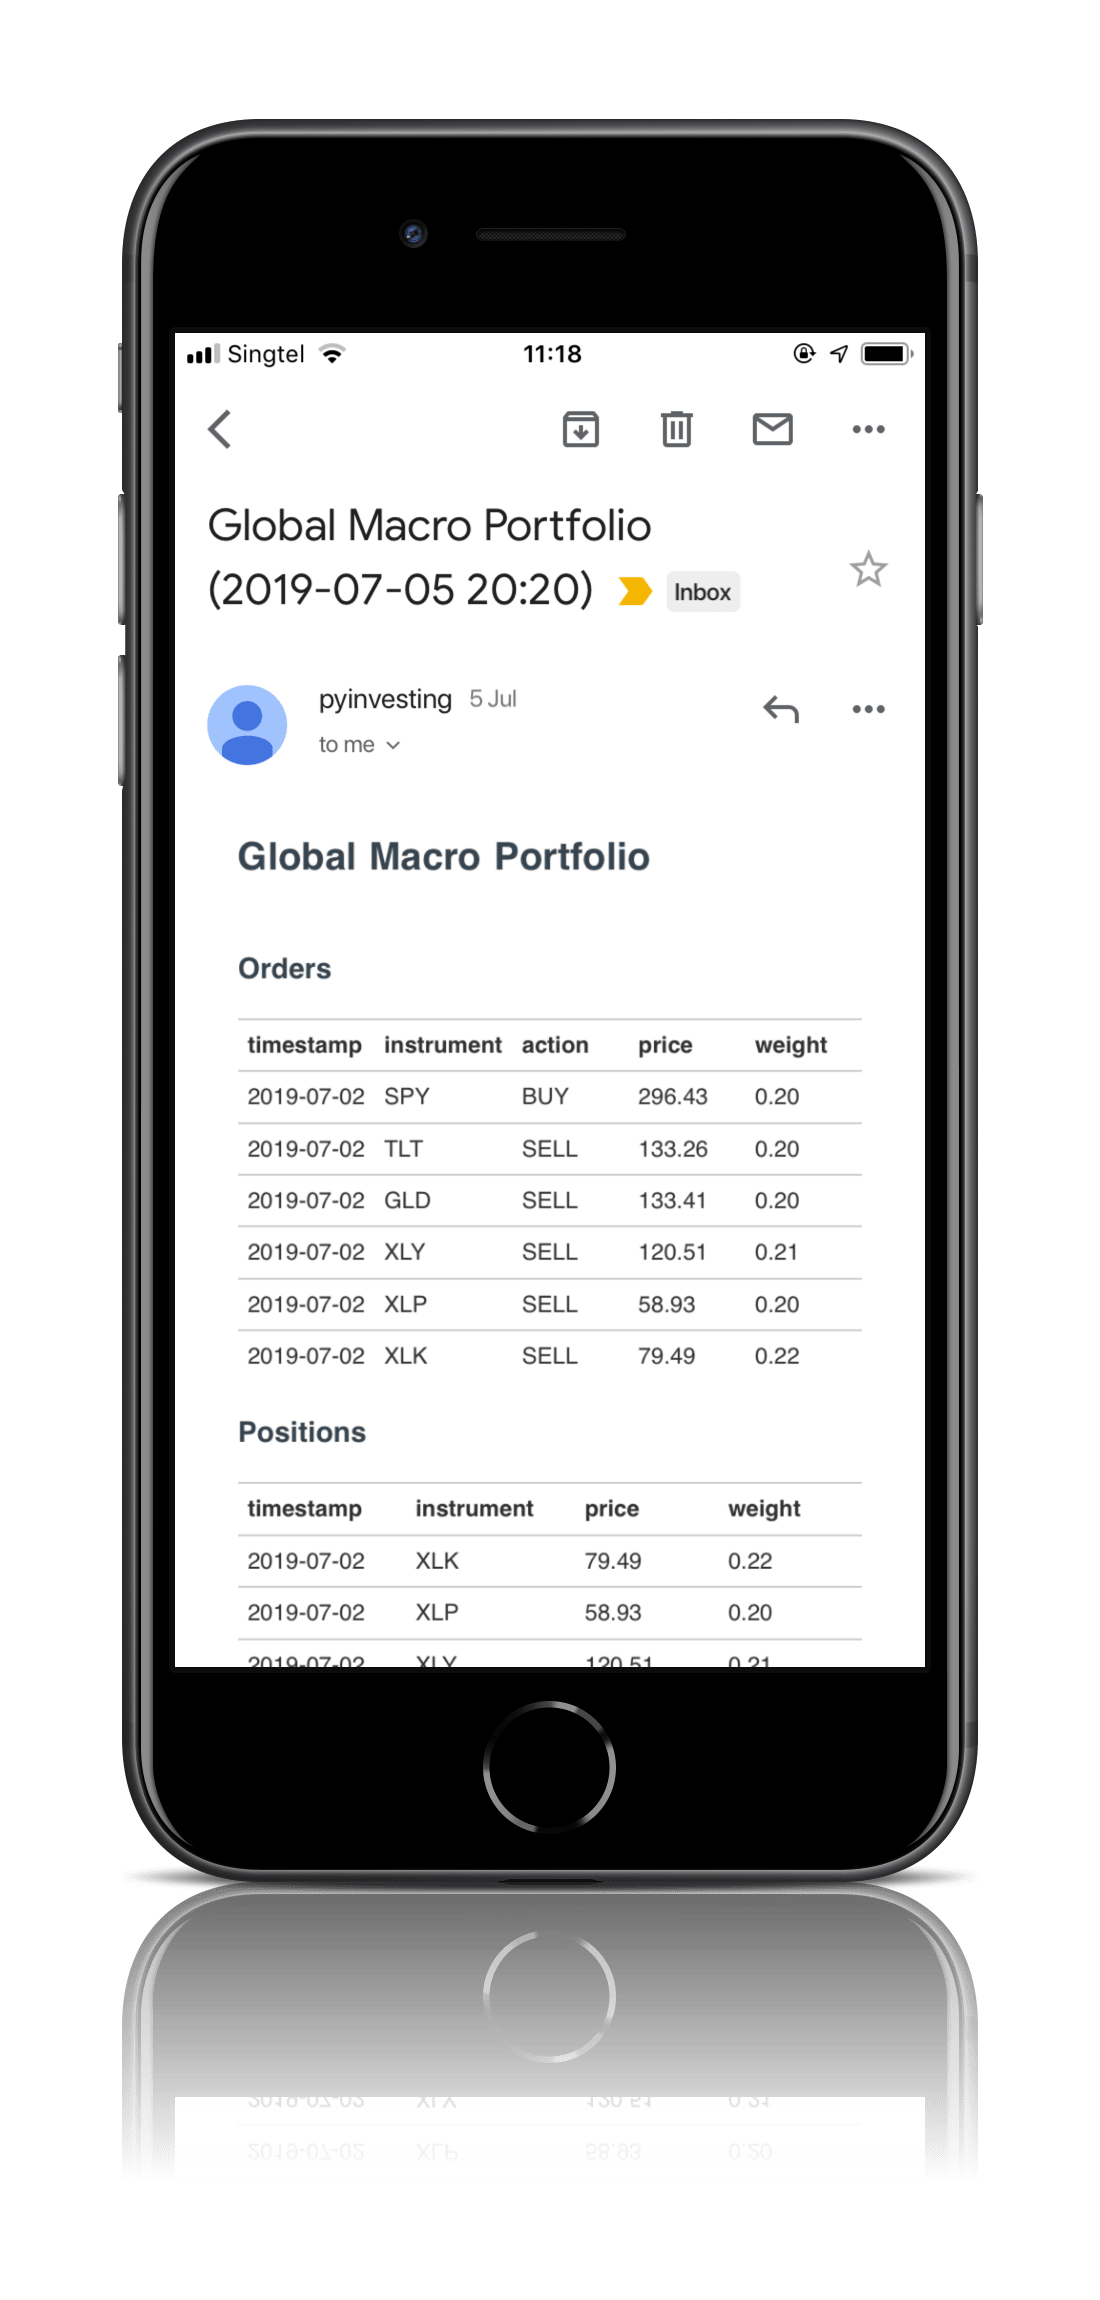
This example selects from 23 ETFs covering equities, bonds, REITs and gold. Each week, ETFs above their 120-day exponential moving average are ranked using equally weighted three-month and six-month returns. Up to seven qualifying ETFs form an equally weighted portfolio.
Data-quality notes. Unavailable ranking observations were omitted, factor weights were redistributed over available inputs where necessary, and 15 rebalances with no valid targets were skipped. This uses a fixed ETF universe, not a point-in-time universe.
Simulated monitoring
- Recorded request period
- 2005-07-01 to 2026-10-23
- Currency
- USD
- Recorded status
- Completed
- Universe coverage
- Selected instruments
- Statistics scope
- Recorded NAV observations
- Costs
- Cost breakdown unavailable in this summary. Review recorded assumptions below.
Read return alongside volatility and drawdown. Review the recorded period, costs and data coverage before comparing strategies. Missing assumptions are unavailable, never assumed to be zero.
How to interpret this result
Chart window controls change the visible history. Zooming the chart does not recalculate the recorded statistics. Simulated allocations and order notifications require your review; they are not evidence of brokerage execution.
Methodology: Backtesting methodology and limitations.
Performance and strategy calculations use adjusted close, including split and dividend adjustments. Quantities are adjusted simulation units.
Statistics use the recorded NAV observations. Annualized return uses the elapsed time between the first and last recorded NAV dates, which can be narrower than the recorded request period. Chart zoom changes only the visible history.
Why does it work?
This trend-following strategy aims to participate in equity uptrends and reduce exposure during downtrends by rotating across asset classes.
The strategy changes its asset allocation as market trends change. In the backtest period reported below, it had lower volatility and a smaller maximum drawdown than SPY, but lower annualized returns and a lower Sharpe ratio.
What is the performance?
The Performance and Statistics tabs show the current verified adjusted-price simulation in USD, with SPY as the S&P 500 ETF benchmark. Annualized returns, volatility, Sharpe ratio and maximum drawdown are calculated from the same published result. Use the chart dates to identify the period being compared. The Positions tab samples historical simulated allocations; its last displayed date can differ from the final performance date.
Research paper
Mebane Faber: A Quantitative Approach to Tactical Asset Allocation
http://papers.ssrn.com/sol3/papers.cfm?abstract_id=962461