An ETF fee comparison begins with a recurring charge, but ends with a sequence of purchases, holding periods and eventual disposals. A small annual advantage can matter greatly if the position remains intact. Whether that advantage outweighs execution friction depends on the actual holding path and whether the displayed prices provide a meaningful comparison.
- A lower annual expense ratio can coexist with higher costs over a particular holding path.
- Regular contributions incur execution friction on the new purchases, rather than repeatedly restarting the existing portfolio.
- The size available at a quote and liquidity of the underlying holdings affect whether a displayed spread is useful evidence.
- A premium against stale valuation data and a persistent execution disadvantage call for different interpretations.
Comparable exposure comes before a cost ranking
MoneySense explains that ETFs following the same index can differ in replication, currency and distribution treatment, as well as cost. Its comparison separates the annual expense ratio from tracking difference, which measures the fund's return gap against its index. That gap already reflects the expense ratio and implementation efficiency. A lower advertised charge therefore does not automatically establish either identical exposure or a smaller realised difference from the index. [3]
Assume the exposure has already been selected and the candidate funds are materially comparable. State Street's ownership cost framework then gives the holding period a decisive role: recurring charges tend to matter more for long holdings, while frequent trading gives transaction costs more influence. The question is consequently how the chosen exposure will be acquired and held. It does not require reopening whether the underlying investment strategy should trade at all. [2]
Fund expenses and execution affect value on different clocks
The SEC's fund expense bulletin describes operating expenses as recurring charges paid from fund assets. Their effect reduces the value represented by investors' shares, rather than appearing solely as a separate payment by the shareholder. The bulletin also identifies brokerage commissions among costs outside the fund's fee table. The ongoing fund charge and the investor's cost of transacting are therefore distinct parts of an ownership comparison, even when both reduce the eventual outcome. [4]
Vanguard distinguishes the dealer's purchase price from its higher sale price. Those are the bid and ask available to opposite sides of an exchange trade. For a cost comparison, the relevant evidence is the entry or exit price obtained against a consistent reference. The full displayed gap is not a separate invoice to attach automatically to each side. Counting the same price concession again would exaggerate the trading disadvantage being compared with annual charges. [1]
Contributions do not restart the whole holding
Consider an established position receiving further contributions, with no sale of the existing units. Each purchase creates a new slice with its own entry cost and remaining holding period. Earlier capital continues to be held rather than traded again. Under State Street's distinction between holding and transaction costs, this path differs from repeatedly replacing the entire position. Calling both approaches regular investing would conceal which capital actually incurs execution friction on each occasion. [2]
MoneySense explicitly notes that a wide spread remains relevant for regular purchases. That supports evaluating the contribution path, without charging a fresh trade to the untouched balance. Its tracking difference explanation also prevents a second error: if a comparison already uses fund performance relative to the index after expenses, subtracting the annual expense ratio again would duplicate a cost. Execution evidence must complement the selected performance convention rather than obscure what it already includes. [3]
The strongest defence of the lower fee is a position expected to remain unchanged for a substantial period. Conditional on comparable exposure and a bounded extra entry cost, a recurring expense advantage keeps applying to the assets held while that initial trade is not repeated. The SEC's fund asset mechanism gives this defence economic substance. It weakens if the assumed holding is interrupted, and it cannot identify a precise recovery horizon without actual cost observations. [4]
The displayed quote applies to a size
Fidelity's trading guidance pairs the spread with the quantity available at the quoted prices. It also describes executions better than the displayed offer or bid, and warns that a large order can exhaust available depth and encounter different prices. These details limit what a single screen quote establishes. The intended transaction size and achievable execution belong in the comparison; the displayed spread alone is neither a guaranteed cost nor proof of available capacity. [6]
BlackRock identifies screen measures including typical spreads and trading volume as indicators of ETF liquidity. For a large transaction, however, its explanation gives greater importance to liquidity in the underlying securities. It also associates poor liquidity with higher dealing costs or difficulty transacting. This places the holdings alongside the exchange statistics in an execution assessment. A ranking based only on how actively the fund's shares recently traded leaves out that additional source of liquidity information. [7]
A premium can reflect different valuation clocks
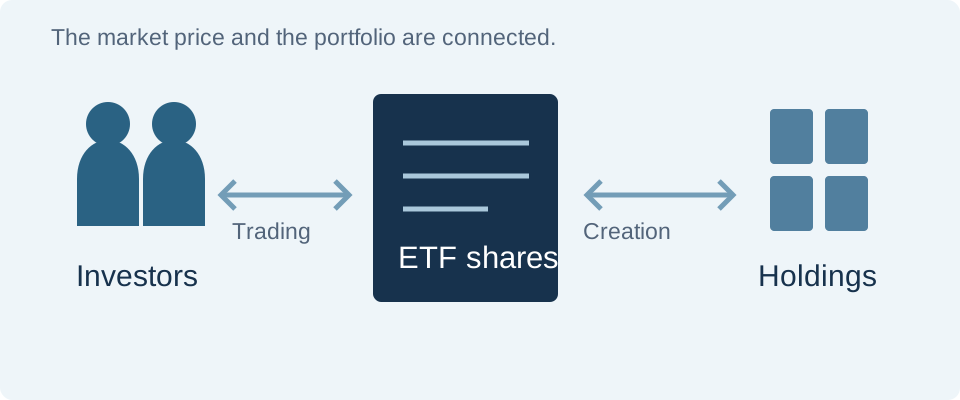
Vanguard explains that ETF creation and redemption can help align share prices with the value of the underlying holdings. Higher costs of trading those holdings can widen the range within which a premium or discount appears. A different mechanism arises when the holdings' markets are closed: current ETF prices can be compared with stale security prices. The resulting apparent premium or discount may partly reflect the mismatch between valuation times. [8]
Those mechanisms call for different judgments about a supposedly expensive entry. If the reference value is stale, treating the entire observed gap as an additional trading penalty can confuse price updating with poor execution. If underlying transactions are persistently costly, the gap raises a more durable implementation concern. The fee comparison first needs evidence identifying the mechanism. A premium, spread and price impact cannot simply be accumulated as independent charges when they describe overlapping price differences. [8]
Suppose a fund has modest screen volume but a quote sufficient for the intended order, supported by liquid holdings. Its volume alone is weak evidence of an expensive acquisition. Conversely, attractive screen statistics cannot establish the price available for an order larger than displayed depth. BlackRock's holdings distinction and Fidelity's size warning favour evidence tied to the intended transaction. Repeated observations at relevant sizes would carry more weight than a single liquidity label. [7] [6]
Price protection leaves an execution risk
The New York Stock Exchange distinguishes a market order seeking the next available price from a limit order specifying an acceptable maximum purchase price or minimum sale price. Available opposite side liquidity supports execution of the former, while the latter may remain unfilled. The exchange also warns that a quote seen in a brokerage account can change before the order reaches the venue. Price control and assurance of completing the transaction are different properties. [5]
For an already chosen exposure, a restrictive limit is therefore not costless certainty. If it remains unfilled while the desired exposure moves away, the intended holding path changes. The NYSE's price versus execution distinction makes that tradeoff explicit. A limit can bound an acceptable price without proving the chosen price represents fair value. An ownership comparison needs feasible execution assumptions, rather than crediting the cheaper fund with an entry that was never available. [5]
Editorial assessment. The lower fee deserves greater weight when a credible long holding path lets its recurring advantage work against a measured, bounded execution disadvantage. Short holdings or repeated replacement demand a stronger case, while incremental contributions require their own holding periods and trade sizes. The decisive preliminary judgment is whether the observed price gap is genuine friction, a stale valuation comparison or an unavailable quote. A persistent disadvantage needs evidence of executable prices against a meaningful valuation reference, rather than the premium label alone. This makes acquisition evidence part of choosing the vehicle for an existing exposure, without turning the exercise into a new strategy timing rule.
Evidence scope. The analysis uses primary educational explanations, without current quotes, product rankings or an estimated recovery period for fee savings. Future holding periods and exit conditions remain assumptions. The hypothetical contribution and order paths illustrate mechanisms, not measured outcomes. Fund structure and exposure must be compared separately. No claim is made that a particular trading window, order type or displayed premium reliably identifies the cheapest attainable transaction.
Related research on checking an ETF's currency exposure before comparing vehicles