Methods and evidence
What fewer stocks above a moving average means
When the percentage of stocks above a moving average falls, fewer stocks in the measured universe satisfy that trend rule. That is a loss of participation. It can accompany a broad sell-off, or it can happen while a few heavily weighted stocks keep an index rising. It does not, on its own, forecast the next market move.
Separate the level from the change
If 70 of 100 stocks are above their moving average, breadth is 70%. If the count later falls to 55, breadth is 55%: a decline of 15 percentage points. The reading still describes a majority of stocks above the threshold. A move from 30% to 45% has the opposite direction but a lower final level. Both pieces of information matter.
The moving average matters too. A short lookback usually reacts more quickly and can fluctuate more. PyInvesting's live breadth measure uses a six-month exponential moving average. Do not relabel it as a 200-day simple-moving-average measure.
Original study: 1,038 weekly observations
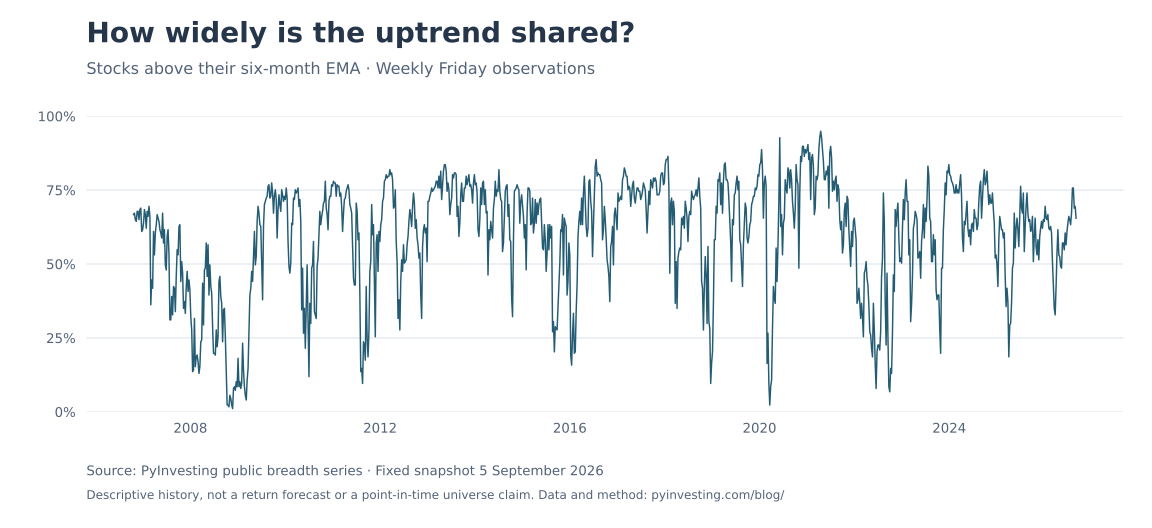
We took a fixed snapshot of PyInvesting's public breadth series on 5 September 2026 and retained Friday calendar observations from 20 October 2006 through 4 September 2026. The resulting 1,038 observations describe the history of the stored indicator. They are not a return backtest or a reconstruction of a point-in-time constituent universe.
| Observation | Result |
|---|---|
| All Friday observations | 1,038 |
| Breadth strictly below 25% | 78 observations (7.5%) |
| Breadth strictly above 75% | 231 observations (22.3%) |
| 2008 Friday observations below 25% | 28 of 52 |
| 2013 Friday observations above 75% | 34 of 52 |
The distribution was not uniform, and extreme readings clustered in particular years. That is a reason to avoid treating observations as independent coin flips. These counts say how often a reading appeared in this dataset; they do not say what the next week's return will be.
Reproduce or reuse the study
Download the weekly CSV, annual summary and provenance, fixed breadth input, Python calculation script and PNG chart. The script uses Python's standard library for the statistics and Matplotlib for the charts (tested with version 3.11.1). Run python build_breadth_study.py breadth-source.json output to regenerate the CSV, summary and charts.
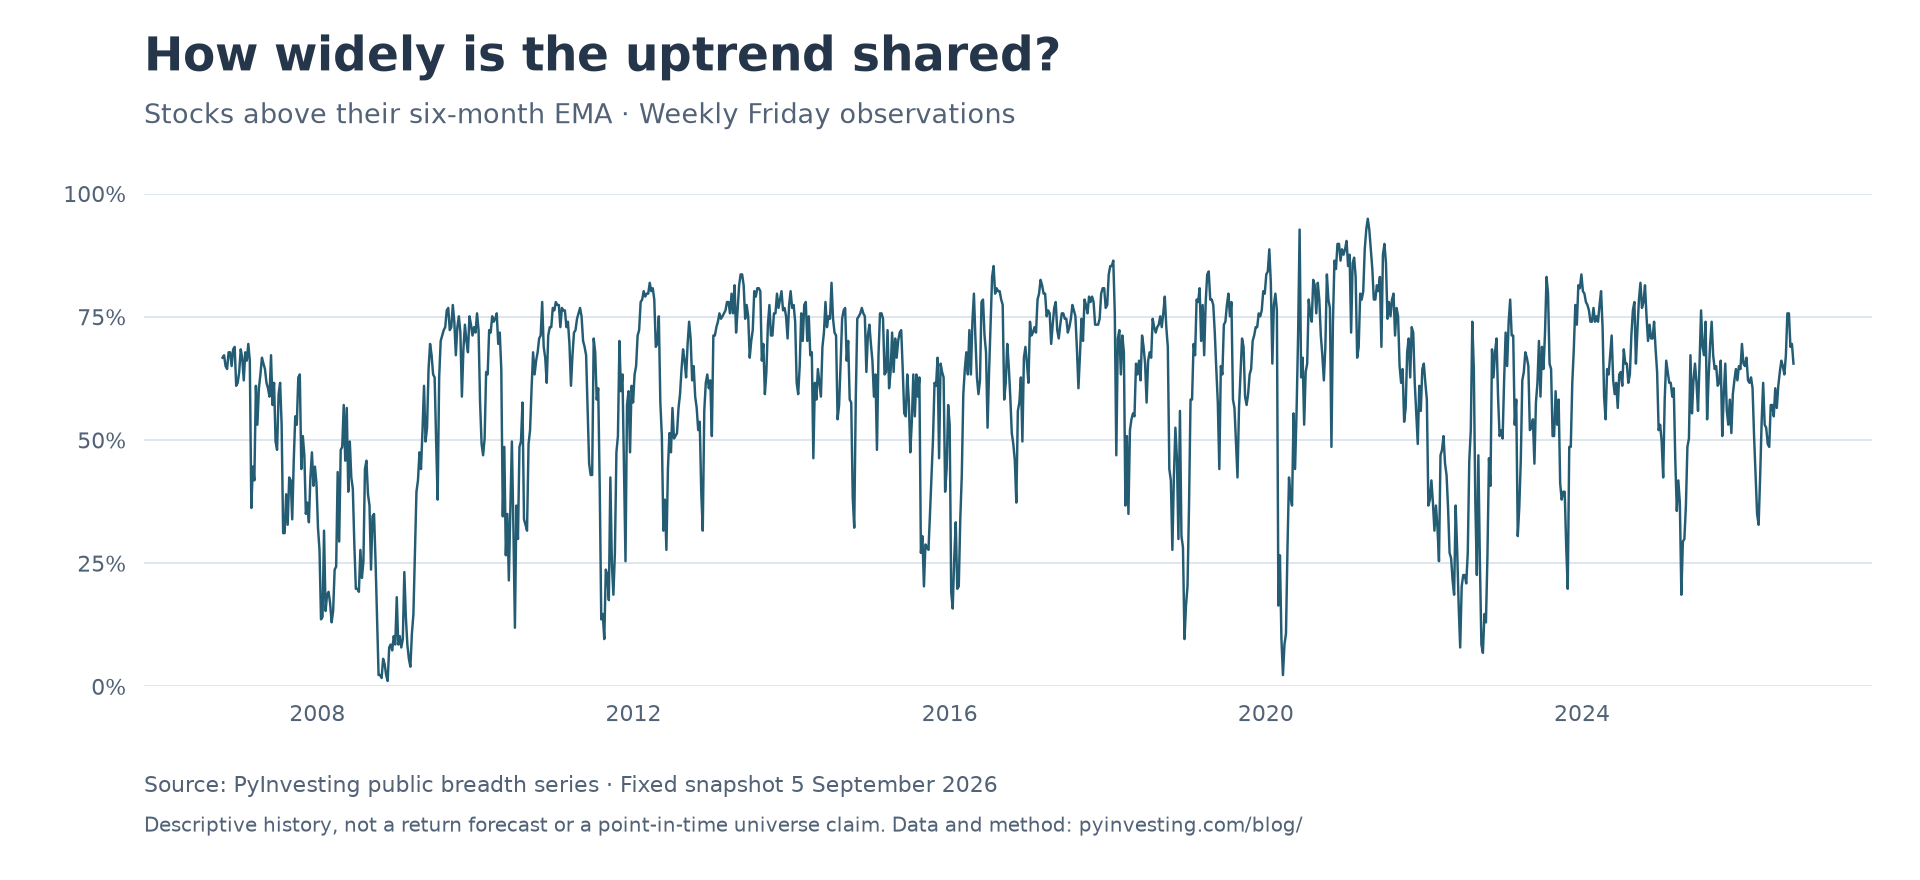
The fixed input contains only the public breadth observations from the chart's data endpoint. The summary includes its SHA-256 checksum. Each date is interpreted in UTC; we select Fridays, retain the displayed precision, and count values strictly below 25 or above 75. The first and last years are partial years. No future returns or optimized thresholds are included.
You may reuse the chart and study tables with attribution to PyInvesting and a link to this page. Describe them as a fixed historical snapshot. The live endpoint can change as new observations or data corrections arrive.
What the study cannot establish
The public series alone does not supply a constituent-by-constituent audit, historical membership snapshots or information-availability timestamps. It therefore cannot establish that survivorship bias, retrospective universe changes or revised prices are absent. Friday snapshots can miss moves within a week; holidays and repeated stored values do not create independent market observations.
To evaluate a trading rule, specify when the signal becomes known, what trades can occur afterward, the investable universe, transaction costs and an untouched evaluation period. The worked allocation example shows this separation. For a different sentiment measure, read breadth versus CNN's Fear & Greed Index.